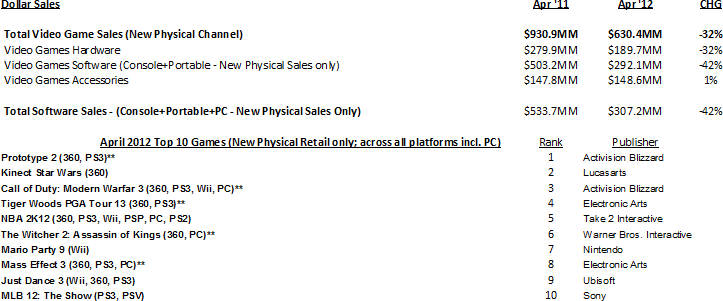
April12 US Video Games Retail Sales (NPD Group)
Analysis from NPD Group analyst, Anita Frazier
The total consumer spend on games in April is estimated at $1.0B including hardware, accessories and content which includes new physical sales at retail, used games, rentals, digital full game downloads and downloadable add-on content, subscriptions, mobile games and social network gaming. New physical retail generates the greatest portion of the consumer spend on the industry, representing roughly 65% of the total spent by consumers.
Overall New Physical Sales
This year, Easter fell very early in April, which means most Easter-related purchases may have fallen into March this year, whereas last year, Easter fell late in April causing most sales to fall in that month. We usually find that Easter-related purchases generate an extra 10 percent in revenue in the month they occur, so some of the softness compared to last April could be attributed to the shift in Easter timing.
NPD Group's U.S. Games Industry Sales (New Physical Sales Channel*) - April 2012
4-week month; Reporting Period 4/1/12 through 4/28/12

Hardware
One thing to keep in mind is that the 3DS has outsold the DS by about one million units in their respective first 14 months in the market, and the DS went on to become the best-selling gaming hardware system ever.
The average selling price for hardware increased over last April, with one of the drivers of that increase being the Star Wars Kinect 360 bundle, which included the Xbox 360 console and controller, a Kinect sensor, and Kinect Star Wars game.
Content
I think what the new physical retail content sales reflect a very light release schedule in terms of the amount of compelling new games. Last April, the top seven titles outsold the top-selling title this year, and, simply stated, there were notably fewer new market introductions. I think it's a simple as that because when we see compelling content come into the market, the games are still selling as well as ever - we just saw a lot less this April as compared to last.
Kid Icarus: Uprising on the 3DS ranked among the top 10 SKU's for the month, and would have made the list if we were reporting on SKU rather than total title level.
For some insight into digital purchasing of content, we can look at the performance of points and subscription cards which was up 75 percent in units over last April. These could very well have been last minute additions to Easter baskets early in the month.
Accessories
Skylanders characters remain a strong driver of accessory sales. The three character pack SKU's have sold just under 10 million units in the U.S. since their launch into the market last October.