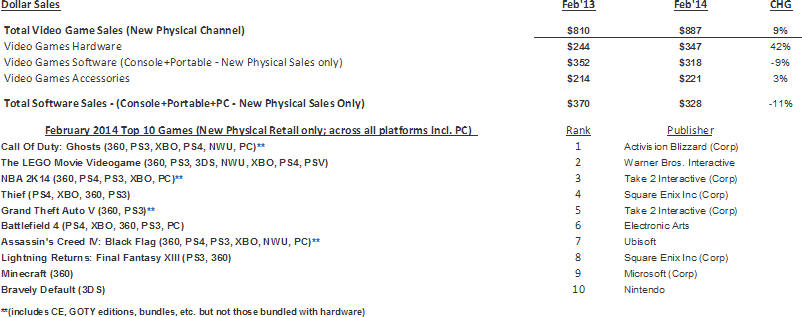
Video Games retail / e-tail sales in U.S. February 2014
These sales figures represent new physical retail sales of hardware, software and accessories, which account for roughly 50 percent of the total consumer spend on games. When you consider our preliminary estimate for other physical format sales in January such as used and rentals at $131 million, and our estimate for digital format sales including full game and add-on content downloads including microtransactions, subscriptions, mobile apps and the consumer spend on social network games at $512 million, we would estimate the total consumer spend in February to be $1.47 billion. Our final assessment of the consumer spend in these areas outside of new physical retail sales will be reported in May in our Q1 Games Market Dynamics: U.S. report.
In February 2014, retail video game sales across hardware, software, and accessories grew 9 percent over February 2013, driven by strong growth in hardware and a slight rise in accessory sales.
NPD Group's U.S. Games Industry Sales (New Physical Sales Channel*) - February 2014
4-week month; Reporting Period 02/02/14 through 03/01/14

Hardware
February 2014 hardware sales increased by 42 percent over February 2013 due to an over 60 percent increase in console hardware sales. Within console hardware, we continue to see strong year-over-year increases due to the success of the Xbox One and PS4.
PS4 led hardware sales in February 2014, but by a narrow margin with Xbox One selling over 90% of what the PS4 sold in terms of unit sales. However, with Xbox One's higher price point it led hardware sales on a dollar basis.
The majority of hardware platforms experienced double-to-triple digit increases compared to January 2014.
Software
PS4 and Xbox One software sales are off to a great start through February 2014. When compared to the combined first four month sales for the Xbox 360 and the PS3, software sales for the Xbox One and PS4 thorough month 4 are up 80 percent.
Despite positive performance of PS4 and Xbox One, the majority of software losses stemmed from declines for seventh generation consoles (Xbox 360, PS3 and Wii), which is expected as we transition from one console generation to another.
February 2014 saw positive software sales for Nintendo's 3DS and the Wii U, lifted by new software launches of Bravely Default and Donkey Kong Country: Tropical Freeze.
Unlike the last few months where declines stemmed from the performance of new launches relative to last year, February 2014 launches were on par with those launching in February 2013 on a unit basis with only 1 percent fewer sales. Due to lower average selling prices of games like The LEGO Movie Video game, and Plants vs Zombies: Garden Warfare, dollar sales of new launches decreased by 15% versus the performance of February launches
NWU Donkey Kong Country: Tropical Freeze was the fourth highest selling video game SKU, but did not rank in the top ten when looking at title-level sales.
Accessories
Video game accessory sales rose by 3 percent this February versus February 2013, due to positive sales of Interactive Gaming Toys, Gamepads, as well as Video Game Point and Subscription Cards.
Video Game Point and Subscription Cards was the highest selling accessory in terms of dollars and units in February 2014, while Gamepads had the highest volumetric increase in dollar sales over February 2013.
February 2014 marked the highest February on record for Video Game Point and Subscription Cards sales on both a dollar and unit basis.