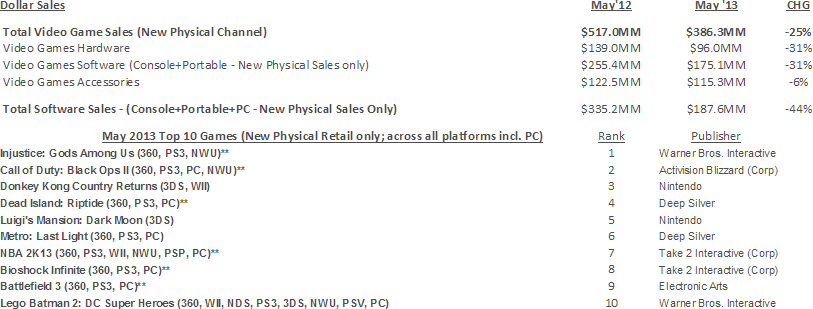
Video Games retail / e-tail sales in U.S. May 2013
These sales figures represent new physical retail sales of hardware, software and accessories, which account for roughly 50 percent of the total consumer spend on games. When taking into account our preliminary estimate for other physical format sales in May such as used and rentals at $91 million, and our estimate for digital format sales including full game and add-on content downloads including micro-transactions, subscriptions, mobile apps and the consumer spend on social network games at $339 million, the total consumer spend in May is $787 million.
NPDs final assessment of the consumer spend in these areas outside of new physical retail sales will be reported in August in its Q2 2013 Games Market Dynamics: U.S. report.
NPD Group's U.S. Games Industry Sales (New Physical Sales Channel*) - May 2013
4-week month; Reporting Period 5/5/13 through 6/1/13

Hardware
Nintendo's 3DS edged out the 360 as the top selling platform across hardware and portables. However, the 360 was the top selling console hardware platform this month for the twenty-ninth consecutive month.
The 3DS had the best year-over-year trending for hardware units, with units sales essentially flat from last May.
Software
Softness in new physical entertainment software sales stemmed from a decline in the number of new launches, with over 30% fewer new SKUs, as well as poor performance of the new SKUs that were released. New SKUs generated over seventy percent less units on a per-SKU basis, and a decrease of over eighty percent revenue per SKU.
Nintendo 3DS software unit sales were up sixty percent versus May '12, and when looking at the game ranking based on SKUs, there were three 3DS SKUs in the top 10.
Overall entertainment software declines, down forty-four percent, were driven partly by sharp year-over-year declines within PC games due to poor comparisons to last year's Diablo 3 release.
Softness in new physical entertainment software sales stemmed from a decline in the number of new launches, with over 30% fewer new SKUs, as well as poor performance of the new SKUs that were released. New SKUs generated over seventy percent less units on a per-SKU basis, and a decrease of over eighty percent revenue per SKU.
Overall new launch performance in May'13 was poor, down 84% in units, decreasing 88% in dollars, which was driven by PCs and Consoles as new launches for portables were up 5% in units, and down only 7% in dollars.
In May 2013, the top 10 games represented a lower percentage of sales compared to games from the previous few Mays at 18% of overall unit sales and 25% of overall dollars, compared to 30% of units and 45% of dollars in May 2012. This is contrary to trends we've been seeing over the last few years with the top ten games generating a larger percentage of overall sales and may be indicative of the weak new launch performance this May.
Accessories
This is best May for point and subscription card sales on record for both unit and dollar sales.
Year-to-date, Skylanders accessory sales are trending positively, up close to fifty percent in unit sales and sixty percent in dollars compared to last year.
As we often see accessory sales tied to hardware sales, May 2013 3DS Accessories (not including point cards) had the lowest decline across platforms, down only 2 percent.