Video Games sales in U.S. (retail & digital) - May 2017
Analysis from NPD's VG industry analyst, Mat Piscatella
Total video game spending in May 2017, which includes hardware, software and accessories, fell 11 percent versus year ago to $542 million. Spending growth in hardware and accessories was offset by a decline in software spending driven by a lighter new release slate when compared to May 2016.
NPD Group's U.S. Games Industry Sales - May 2017
5-week month ; Reporting Period 04/30/17 through 05/03/17
| Dollar Sales | May'16 | May'17 | Chg |
|---|---|---|---|
| Total Video Game Sales | $610M | $542M | -11% |
| Video Games Hardware | $138M | $147M | 7% |
| *Video Games Software (Console+Portable ; Physical and Full Game Digital Formats from the PSN, and Xbox Live platforms) | $339M | $271M | -20% |
| *PC Games Software (PC ; Physical and Full Game Digital Formats from the Steam platform) | $23M | $12M | -48% |
| **Video Games Accessories | $111M | $112M | 1% |
Hardware
Hardware spending grew 7 percent compared to May 2016, to $147m. Nintendo Switch continues to be the primary catalyst for hardware spending gains, as it has since launching in March 2017.
Year to date, hardware spending has grown 18 percent as gains in console spending have offset declines in portable.
Sony's PlayStation 4 was the best-selling hardware platform of the month.
On a time-aligned basis over each product's first 43 months in market, the combined installed base of Sony's PlayStation 4 and Microsoft's Xbox One now exceeds the combined installed base of the PlayStation 3 and Xbox 360 by 29 percent.
Software
 Video game software dollar sales in May 2017 fell 20 percent versus year ago to $271m. The new release slate of May 2016, led by Uncharted 4 : A Thief's End, Overwatch and Doom proved a challenging comparable.
Year to date, video game software dollar sales are flat versus 2016, at $1.9B.
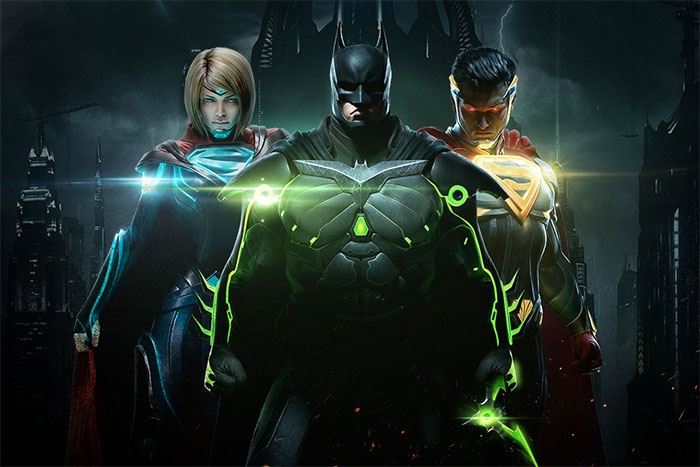
Injustice 2 from Warner Bros. Interactive was the best-selling title of the month. Warner Bros. Interactive was the month's top-selling publisher.
The launch of Nintendo's Fire Emblem Echoes : Shadow of Valentia pushed May portable software spending up 10 percent versus year ago.
May 2017 Top 20 Games (Physical and Full Game Digital Formats for publishers in the digital panel ; across all platforms incl. PC), ranked on dollar sales
| Title | Rank | Publisher |
|---|---|---|
| Injustice 2 | 1 | Warner Bros. Interactive |
| Mario Kart 8*** | 2 | Nintendo |
| Grand Theft Auto V | 3 | Take 2 Interactive |
| The Legend of Zelda : Breath of the Wild*** | 4 | Nintendo |
| Prey 2017*** | 5 | Bethesda Softworks |
| Tom Clancy's Ghost Recon : Wildlands | 6 | Ubisoft |
| Fire Emblem Echoes : Shadow of Valentia*** | 7 | Nintendo |
| NBA 2K17 | 8 | Take 2 Interactive |
| MLB 17 : The Show | 9 | Sony |
| Overwatch^ | 10 | Activision Blizzard |
| Tom Clancy's Rainbow Six : Siege | 11 | Ubisoft |
| Horizon Zero Dawn | 12 | Sony |
| Call of Duty : Infinite Warfare | 13 | Activision Blizzard |
| Call of Duty : Black Ops III | 14 | Activision Blizzard |
| Mass Effect : Andromeda | 15 | Electronic Arts |
| Farpoint | 16 | Sony |
| Battlefield 1 | 17 | Electronic Arts |
| Nier : Automata | 18 | Square Enix Inc |
| Minecraft | 19 | Microsoft |
| FIFA 17 | 20 | Electronic Arts |
Accessories
Total spend on Accessories and Gamecards** grew 1 percent compared to a year ago, to $112m.
Gamepad sales grew 6 percent in April compared to a year ago. The Nintendo Switch Pro Controller was the #1 Gamepad of the month.